Some of GISMO visualizations
There there are some screenshots that may give you a basic idea about the visualizations that can be created by GISMO. These pictures are described in the help page that is available from the main menu on the top of GISMO user interface.
More visualizations and tutorials are available at http://moclog.ch/tutorials/
Accesses overview
A graph reporting the student's accesses to the course.
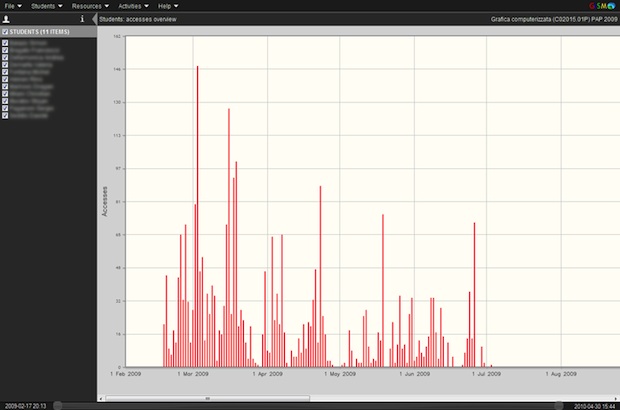
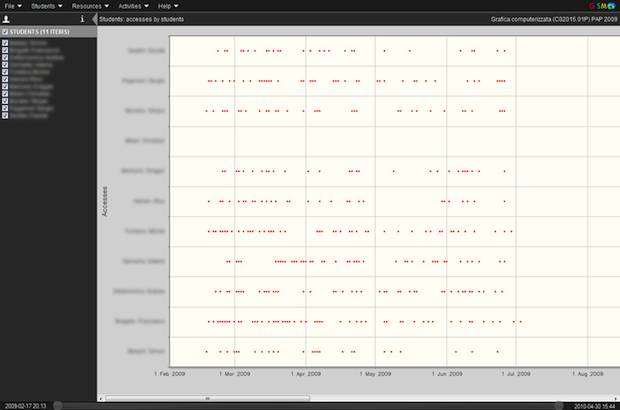
Accesses to the course
A graph reporting accesses for each student in a timeline.
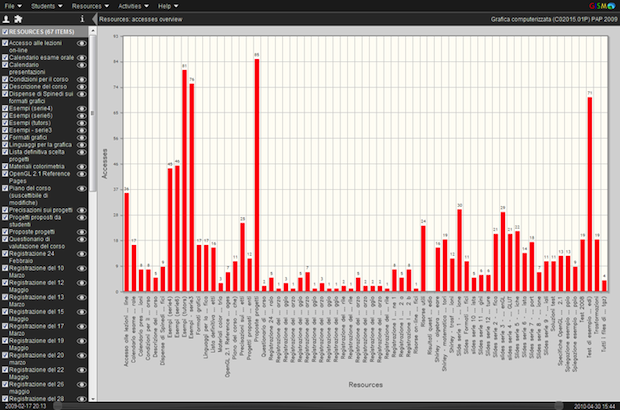
Accesses overview on resources
A graph reporting the number of accesses made by the students to the resources of the course

Assignments overview
A graph reporting the submission of assignments. Color is mapped to the grade assigned by the teacher.

Quizzes overview
A graph reporting the submission of quizzes. Color is mapped to the grade.

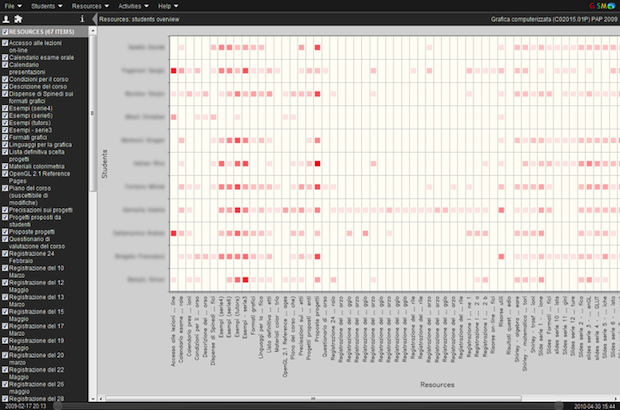
Resources accesses overview
A graph reporting an overview of the number of accesses to resources of the course.
Resources accessed by a paricular student
A graph reporting an overview of the student's accesses to resources on a timeline.

Students' accesses to resources
A graph reporting, for each student, the number of accesses to resources of the course.